

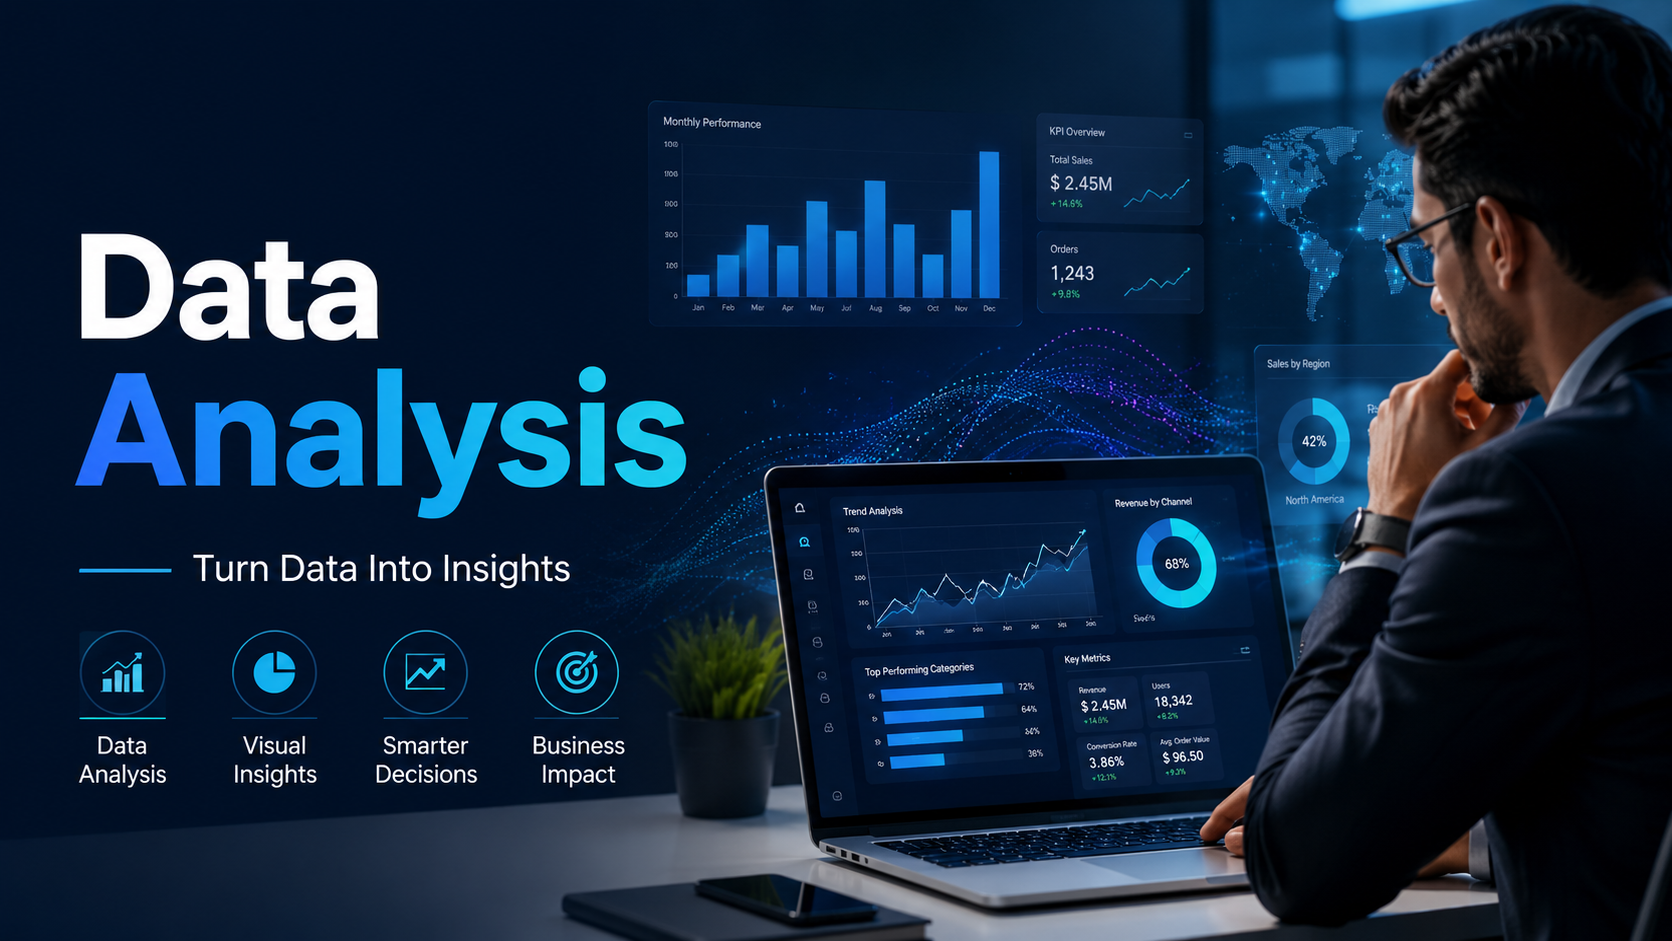
Kaizen Digital Hub provides data analysis services that help businesses transform raw, disconnected information into clear and actionable insights. We examine business, sales, marketing, website, customer, and operational data to uncover meaningful patterns and support more informed decision-making.
Most businesses already collect valuable information through websites, advertising platforms, sales records, customer databases, spreadsheets, social media accounts, and internal systems. However, collecting data is not enough. When information is inconsistent, scattered across multiple platforms, or presented without context, it becomes difficult to understand what is working and where improvement is needed.
Our approach focuses on turning complex data into practical findings. We help you understand performance, compare results, identify opportunities, recognize possible risks, and decide what action should come next.
Turn Raw Data Into Actionable Business Insights
Effective data analysis should do more than produce charts or summarize numbers. It should answer a clear business question.
You may need to understand why sales changed, which marketing channel generated valuable leads, where customers leave your website, which product performs best, or whether an operational process is becoming more efficient. We define the purpose of the analysis first and then focus on the data that can help answer that question.
This goal-driven approach prevents businesses from becoming distracted by vanity metrics or reports that look impressive but provide little practical value. Instead, the analysis remains connected to measurable business priorities.
Our Data Analysis Services
Business Performance Analysis
Business performance analysis helps organizations understand how important areas of the company are performing over time. We review relevant metrics, compare reporting periods, and identify changes that may require attention.
Depending on the available data, the analysis may cover revenue, sales activity, service demand, customer acquisition, productivity, operational output, campaign performance, or other business indicators.
Rather than presenting isolated numbers, we place the findings within the correct context. This helps decision-makers understand whether a result represents genuine progress, a temporary change, a seasonal pattern, or a possible performance issue.
Our business data analysis services can also help teams establish a clearer reporting structure. When the right indicators are monitored consistently, it becomes easier to evaluate progress and respond before small problems become larger ones.
Marketing Data Analysis
Marketing data analysis helps businesses understand which campaigns, channels, audiences, and messages contribute to meaningful results.
We examine available data from advertising platforms, website analytics, campaign reports, lead-generation systems, social media accounts, and other relevant sources. The analysis may include traffic, engagement, enquiries, conversion rates, campaign costs, cost per lead, customer actions, and return on marketing activity.
The goal is not simply to identify the campaign with the highest number of clicks. A campaign may attract significant traffic without generating qualified leads or sales. We therefore review performance in relation to the outcome the campaign was designed to achieve.
Clear marketing analysis can help businesses allocate budgets more effectively, improve audience targeting, refine campaign messaging, and identify channels that deserve further investment.
Website Analytics and User Behaviour Analysis
Website data can reveal how users discover your site, which pages they visit, how they move through the content, and where they leave before completing an important action.
We analyze traffic sources, landing-page performance, engagement patterns, navigation paths, conversion journeys, and important website events. This helps identify pages that attract relevant visitors, pages that fail to hold attention, and points where users may experience confusion or friction.
For example, a service page may receive traffic but generate few enquiries. The issue could relate to unclear messaging, weak calls to action, poor page structure, irrelevant traffic, or technical tracking limitations. Data analysis helps narrow down the most likely areas for investigation.
Google Analytics can report website and app traffic, user activity, events, conversions, and traffic sources, while Google Search Console provides information about search queries, impressions, clicks, indexing, and organic visibility.
Sales Data Analysis
Sales data analysis helps businesses understand which products, services, customer groups, and periods generate stronger results.
We review patterns in revenue, order volume, average transaction value, product demand, repeat purchases, customer acquisition, and seasonal changes where the required information is available.
The analysis can help answer questions such as:
Which products or services generate the most revenue?
Which categories are growing or declining?
When does demand increase or decrease?
Which customer groups make repeat purchases?
Where are sales opportunities being lost?
These questions are closely connected, so we interpret them within the broader business context rather than treating each number separately.
Sales analysis can support pricing discussions, inventory planning, customer-retention efforts, product development, and future sales strategies.
Customer Data Analysis
Customer data analysis helps businesses build a clearer understanding of customer behaviour, preferences, engagement, and value.
Depending on the data available, we may review customer segments, purchase frequency, retention, service usage, response to campaigns, repeat activity, and common points of disengagement.
The purpose is not to collect unnecessary personal information. It is to identify useful patterns within the data the business is permitted to process and use.
Customer insights can support more relevant communication, stronger retention strategies, improved service delivery, and better prioritization of high-value customer groups.
Where customer data is involved, access, privacy, consent, and data-handling requirements should be considered before analysis begins.
Operational Data Analysis
Operational data analysis helps businesses identify inefficiencies, delays, recurring problems, and opportunities for process improvement.
The analysis may focus on order fulfilment, response times, resource usage, staffing patterns, service delivery, inventory movement, workflow completion, or another measurable operational area.
By comparing performance across periods, locations, teams, or process stages, we can identify where delays or inconsistencies occur.
Operational analysis does not automatically prove why a problem exists. However, it can show where further investigation is needed and provide evidence for evaluating possible improvements.
Data Cleaning and Preparation
Reliable analysis depends on reliable data.
Raw business information often contains duplicate entries, missing values, inconsistent labels, incorrect formatting, outdated records, or fields that cannot be compared directly. These issues can create misleading findings if they are not identified before the analysis begins.
We review and prepare the available information by organizing categories, correcting formatting inconsistencies, removing unnecessary duplicates, and documenting important gaps or limitations.
When data comes from several platforms or spreadsheets, we assess how the sources can be combined without changing their meaning. A structured dataset creates a stronger foundation for accurate reporting and future analysis.
Data Visualization and Dashboard Reporting
Complex findings are easier to understand when they are presented clearly.
We create structured reports, charts, tables, and dashboards that highlight important performance indicators without overwhelming the reader. The reporting format is selected according to the audience, available data, and intended use.
Senior decision-makers may need a concise overview of business performance. Marketing teams may need campaign-level details. Operational teams may require regular monitoring of workflow or service metrics.
A useful dashboard should guide attention toward relevant questions and actions rather than display every available number. Tools such as Microsoft Power BI can connect data sources and present information through interactive business-intelligence reports and visualizations.
Custom Reports and KPI Tracking
Every business measures success differently. Generic reports often include metrics that do not match the organization’s actual priorities.
We help define relevant key performance indicators and create reports around the business goals, teams, and decisions those indicators need to support.
A custom reporting structure may include monthly performance comparisons, marketing results, sales trends, customer activity, operational efficiency, or other agreed metrics.
The objective is to create a reporting process that stakeholders can understand and use consistently.
Our Data Analysis Process
1. Define the Business Question
Every data analysis project begins with a clear objective.
We identify what the business wants to understand, which decision the findings need to support, and who will use the final report. This creates a focused direction before the data is reviewed.
A broad request such as “analyze our business” is usually too vague. A more useful question might be why leads declined, which campaign generated the highest-quality enquiries, or which service category produced the strongest growth.
Defining the question early helps determine which data sources, metrics, and comparisons are relevant.
2. Review Data Sources and Quality
Next, we review the available data to understand its structure, completeness, reliability, and limitations.
The information may come from analytics tools, advertising platforms, customer-management systems, sales records, spreadsheets, databases, or internal reports.
We check whether the required dates, categories, identifiers, and metrics are available. We also identify tracking gaps or inconsistencies that could affect the reliability of the findings.
If the data cannot answer the original business question accurately, we explain the limitation instead of presenting an unsupported conclusion.
3. Clean and Organize the Data
Before analysis begins, the data is prepared in a consistent structure.
This may include correcting date formats, standardizing category names, removing duplicate records, organizing fields, and resolving obvious inconsistencies where possible.
The process depends on the volume, source, sensitivity, and intended use of the information.
Data cleaning is an essential step because even an advanced analytical method can produce unreliable results when the underlying records are inaccurate or inconsistent.
4. Analyze Patterns and Performance
Once the information has been prepared, we examine the trends, comparisons, relationships, and performance indicators connected to the original objective.
The analysis may include:
Period-over-period comparisons
Campaign performance evaluation
Customer or product segmentation
Sales and revenue trends
Conversion analysis
Website journey analysis
Operational performance comparison
These methods are selected according to the question and available data. We do not use a complex technique when a simpler comparison provides a clearer and more reliable answer.
5. Interpret the Findings
Numbers require context before they can support a decision.
We interpret the findings in relation to business goals, previous performance, reporting periods, sample size, tracking quality, and any external factors visible within the project scope.
A change in one metric does not always prove that another activity caused it. We therefore distinguish between confirmed findings, reasonable observations, and possible explanations.
This reduces the risk of making an important decision based on an assumption that the data cannot support.
6. Create Reports and Recommendations
The final findings are presented in a clear format suited to the intended audience.
We explain what happened, why the result matters, and which areas may require attention. Where the evidence supports practical action, we provide recommendations or suggest areas for further testing.
Recommendations may involve improving tracking, reviewing a weak-performing channel, adjusting a reporting process, investigating a customer segment, or monitoring an issue over a longer period.
The objective is to make the analysis useful after the report has been delivered.
Why Data Analysis Matters for Business Growth
Business decisions are often made under time pressure and with incomplete information. Data analysis cannot remove every uncertainty, but it can give decision-makers a clearer view of current performance.
By reviewing reliable information, businesses can identify patterns that may be difficult to notice through day-to-day operations alone.
Data analysis help an organization:
Recognize performance changes earlier
Understand which activities produce meaningful outcomes
Identify inefficient processes
Improve reporting consistency
Support budget and resource decisions
Measure the effect of future changes
These outcomes depend on the quality of the available data and the clarity of the business question. For that reason, our analysis begins with the objective rather than a predetermined report template.
Why Choose Us for Data Analysis?
Analysis Connected to Business Objectives
We focus on the business question first.
Instead of reviewing every available metric, we identify the information that is most relevant to the decision, problem, or performance objective.
This keeps the analysis practical and reduces unnecessary reporting.
Clear and Understandable Findings
A data report should be useful to the people responsible for acting on it.
We explain findings in clear language and use charts or tables only when they improve understanding. Technical terminology is used where necessary, but it does not replace a clear explanation of what the data means.
Honest Interpretation
Data can contain gaps, tracking errors, limited sample sizes, and external influences.
We identify these limitations and avoid presenting assumptions as proven conclusions. This gives stakeholders a more realistic foundation for decision-making.
Flexible Reporting
Different teams require different levels of detail.
We can structure reports around executive summaries, marketing performance, sales activity, customer behaviour, website performance, or operational metrics, depending on the project requirements.
Support for Ongoing Improvement
A one-time analysis can identify immediate findings, but regular measurement may provide greater long-term value.
Where ongoing reporting is required, we can organize the analysis around agreed KPIs, reporting periods, and business priorities. This helps teams track progress and evaluate whether future changes produce the intended result.
Data Analysis for Marketing and SEO Performance
Data analysis is especially important when evaluating marketing and organic search performance.
Website traffic alone does not show whether the visitors are relevant. Search rankings alone do not confirm whether users click, engage, or convert. Advertising impressions do not reveal whether a campaign generated valuable enquiries.
A stronger evaluation connects traffic, user behaviour, conversions, campaign cost, and business outcomes.
For SEO performance, this may involve reviewing search impressions, clicks, click-through rates, landing-page engagement, conversions, keyword visibility, and technical issues. For paid marketing, the analysis may include campaign spend, conversion cost, lead quality, audience performance, and landing-page results.
Turn Your Business Data Into Clear Decisions
Your business may already hold valuable information within its website, marketing platforms, sales systems, customer records, and internal reports.
The challenge is turning that information into findings that are clear enough to guide action.
We helps businesses organize data, identify meaningful patterns, create understandable reports, and connect the findings to practical business decisions.
Tell us what you want to measure, which data sources are available, and what question you need the analysis to answer.